
Statistics can feel distant when students first meet it.
Terms such as probability, sample size, distribution, and expected value describe ideas that are hard to see on a page. A simple probability game can make those ideas concrete.
Consider a coin toss. Before the toss, there are two possible outcomes. Students can predict what might happen, record the result, and repeat the process. After ten tosses, the results may look uneven. After hundreds, the proportions often move closer to the expected probabilities.
That simple activity turns a formula into an event students can observe.
Dice, cards, spinners, and other chance-based exercises work in the same way. Students make a prediction, collect data, compare results, and ask why the observed numbers differ from the theoretical model.
This creates a useful link between probability and statistics. Probability starts with a model and estimates what could happen. Statistics starts with observed data and asks what the results can tell us.
Games make that relationship easier to grasp because every round produces fresh data.
Students do not need to memorize an abstract rule first. They can watch uncertainty produce real results, then use statistical tools to explain what they see.
Repeated Outcomes Turn Probability Into Data
A single result tells students very little. Repetition creates something they can measure.
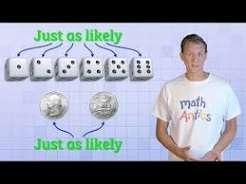
Imagine rolling a fair six-sided die once. Any number from one to six can appear. Roll it 60 times, however, and students can count how often each number occurs. They now have a data set.
This process connects theory with observation.
Theoretical probability describes what a model predicts. Experimental probability measures what actually happened. The two may differ in a small sample.
Digital examples can illustrate the same distinction. A student examining a sequence from an aviator game online may notice short streaks or clusters. Those patterns alone do not establish the probability of the next event. To study the system statistically, the student would need a defined model, enough observations, and reliable data.
This lesson matters far beyond games.
Students learn that small samples can produce strange results. Ten coin tosses might give seven heads and three tails. That does not make heads more probable.
As the sample grows, random variation often becomes easier to separate from stable patterns.
Probability games therefore turn an abstract idea into a practical lesson: more observations can improve an estimate, but a short streak should not be mistaken for a rule.
Games Make Expected Value Easier To Understand
Probability tells students how likely an event is. Expected value adds another question: what is the average result over many trials?
A simple classroom game can make this clear.
Suppose students roll a die. Rolling a six earns six points. Any other number earns zero. A six appears, on average, once in every six rolls. The expected value is therefore one point per roll.
That does not mean each roll gives one point.
One student may score zero points after five rolls. Another may roll two sixes and score 12. Expected value describes the long-run average, not the next result.
This distinction is important.
Students often expect an average to appear in every small sample. A game shows why that assumption fails. Short runs can move far above or below the expected value.
As students repeat the activity, they can compare their actual average with the calculated value.
The exercise turns a formula into a measurable process. Students see that expected value does not predict individual events. It provides a benchmark for comparing many uncertain outcomes.
Small Samples Show Why Randomness Can Look Like A Pattern
Random data rarely looks perfectly balanced.
Flip a coin six times and it might land on heads five times. Roll a die 12 times and one number may never appear. These results can look strange, but they are normal in small samples.
Probability games let students see this effect directly.
A class can run the same experiment in several groups. Each group may produce a different result, even though everyone follows the same rules. When the groups combine their data, the overall pattern often moves closer to the expected distribution.
This teaches an important statistical lesson: sample size affects how much confidence we can place in a result.
A short streak does not prove that the odds have changed. Nor does an unusual cluster reveal a hidden rule by itself.
Students can test this idea rather than accept it as theory. They can compare 10 trials with 100 or 1,000 trials and measure how the proportions change.
The exercise also builds healthy doubt about patterns.
When students encounter surprising data, they learn to ask: How large is the sample? Is the pattern stable? Could random variation explain it?
Those questions sit at the heart of statistical reasoning.
Comparing Predictions With Results Builds Statistical Thinking
Probability games work best when students make a prediction before collecting data.
Suppose a bag contains three red counters and seven blue ones. A student predicts that about 30% of draws will produce red. The class then draws a counter, records its color, replaces it, and repeats the test 100 times.
The final result may be 27 red draws rather than exactly 30.
That difference creates a useful question: Does the prediction fail, or is the gap normal random variation?
Students can answer by running more trials. They can also compare results from several groups. The exercise shows that theoretical probability gives an expected pattern, while observed data contains natural variation.
This process mirrors real statistical work.
Researchers form a hypothesis, gather evidence, and compare what they observe with what their model predicts. They do not expect every sample to match the model perfectly.
Probability games teach this method on a small scale.
Students learn to treat predictions as claims that data can test. They also learn that a difference between a prediction and a result needs context.
That shift is important. Statistics becomes less about finding the “right” number and more about judging what the evidence supports.
Probability Games Make Common Biases Easier To Spot
Students do not always judge random events by probability. They often rely on patterns that feel meaningful.
A coin offers a simple example. Suppose it lands on heads four times in a row. Many people expect tails next because the sequence seems unbalanced.
For a fair coin, the next toss still has the same odds. Earlier tosses do not create a debt that later results must repay.
Probability games expose this error quickly.
Students can record long sequences of coin tosses or dice rolls. They will see streaks, clusters, and repeated values. These patterns may look unusual, yet they can appear through chance alone.
The exercise helps students separate random variation from useful evidence.
It also shows why intuition can fail when people work with uncertain data. A pattern may look convincing without having predictive value.
Students can apply the same test to surveys, experiments, market data, and scientific studies. Instead of trusting a striking sequence, they learn to ask whether the sample provides enough evidence.
That habit is one of the most useful skills statistics can teach.
Hands-On Probability Builds Lasting Statistical Skills
Probability games give students a simple way to explore statistics through action.
A coin, die, deck of cards, or digital simulation can produce enough data for a useful experiment. Students can predict an outcome, run repeated trials, record the results, and compare those results with a mathematical model.
Each step develops a different skill.
Students learn that probability describes likelihood, while statistics helps them study observed results. They see why expected values describe long-run averages rather than single events. They also discover how small samples can create convincing but unreliable patterns.
Most important, students learn to question data.
An unusual result should lead to investigation, not an instant conclusion. Students can check the sample size, repeat the test, compare groups, and decide whether random variation offers a reasonable explanation.
These habits apply far beyond the classroom. The same reasoning supports work in science, economics, technology, and many other fields that depend on uncertain data.
Probability games succeed as teaching tools because they make uncertainty tangible. Students do not just read that randomness can produce surprising results. They collect the results, test them, and learn how statistics explains what happened.